When the CFO asks, you'll know.
Breakdown revenue by product or geo. Scan for missing accruals. Reporting with a complete data foundation means the answer is a query away, not a project.
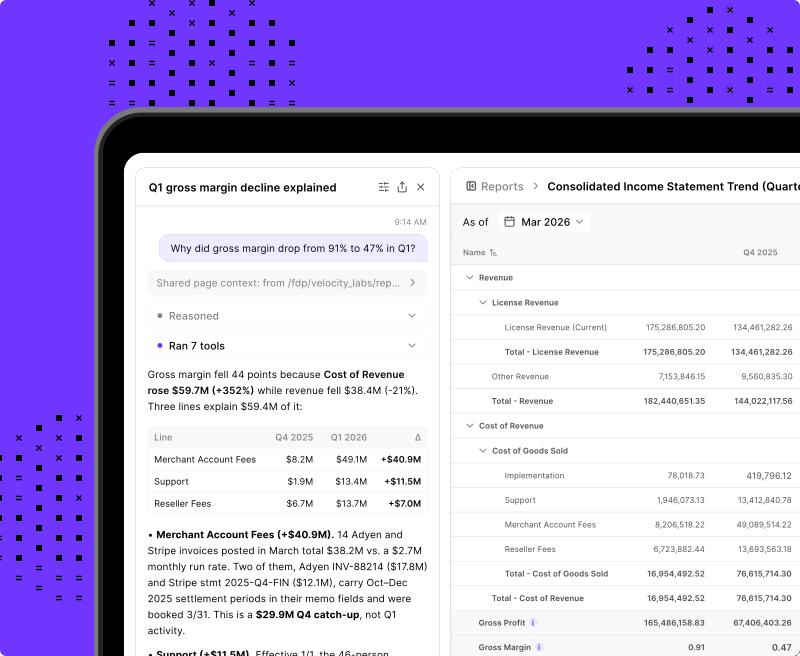
Full flexibility, context, and confidence.
Today, your management reporting lives in Excel. In Numeric, you’ll pivot, group, filter, calculate - leaving behind exports or stale data.
Ask, then verify.
Build a live cashflow dashboard or understand fully loaded employee costs.
Agents translate your question into deterministic queries, so the number is accurate every time it runs.
.svg)
Customize, then automate.
Numeric’s drag and drop report builder is flexible enough to build once, then automate your recurring reports forever.
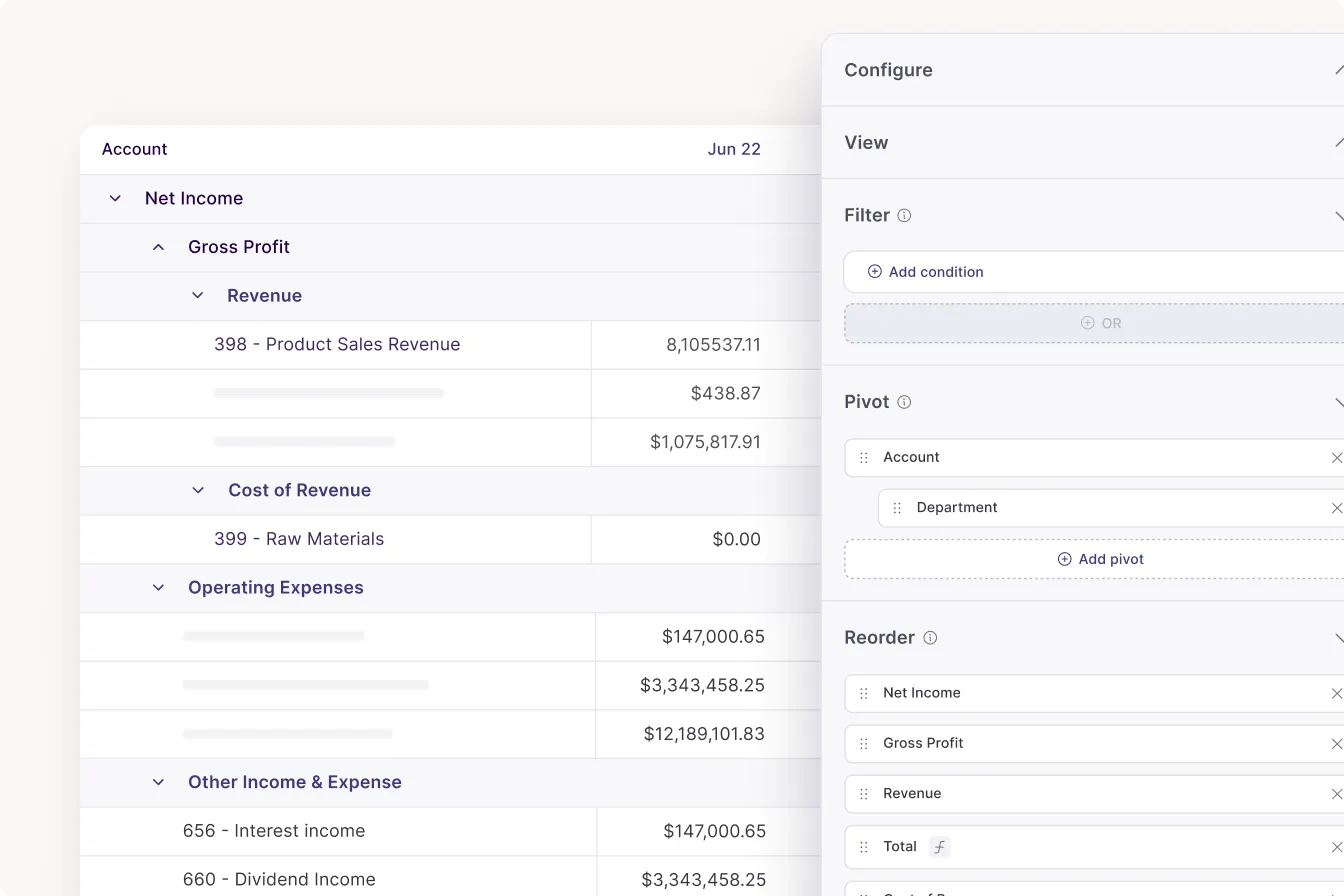
Group OpEx, then cut a department level P&L - all without needing a PhD in your ERP.
Drive decisions with full context.
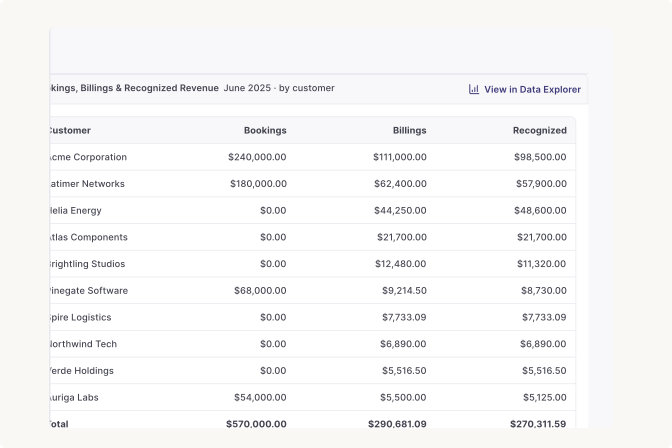
Management reporting and GAAP reporting draw from the same dataset with context from full contracts, invoices, and integrations.
Analyze costs to serve by customer segment or outline revenue per sales channel.
Pivot, group, filter,
calculate
Build the exact reports that your team is forced to manage in Excel, but updating in real-time and with collaboration and audit-readiness features built-in.

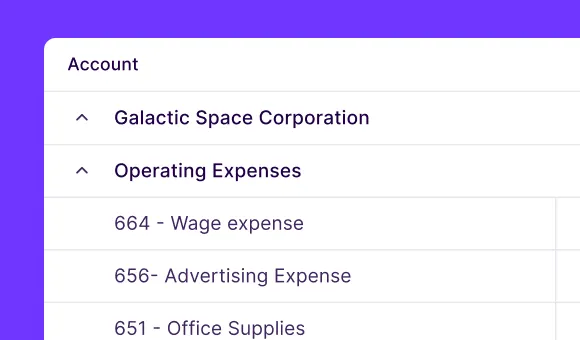


It's almost like having a real live dynamic pivot table with analysis that can be refreshed real time.
It gives you that visibility in a much faster and better way.