Numeric Variance Analysis Software
Turn Your Flux into Financial Clarity
Up-level the strategic insights your accounting team brings to the table. Let AI draft first-pass flux explanations, drill down to the exact transactions resulting in variance, and build flexible reports that fit your business.


Numeric Variance Analysis
Fast, Flexible, + AI-Fueled
Flux used to take days of swimming in Excel. Now, with the power of AI and access to every transaction line from your ERP, flux is the catalyst for transforming accounting teams into strategic business partners.
Use AI to get a headstart on writing flux analysis
Set custom templates for variance analysis explanations for each account, specifying which fields to reference and the desired layout. Bullet points, poetry, an essay— all up to you.
Then with a single click, AI combs through every transaction in your GL and surfaces core drivers of variance for you to simply edit and approve.
.webp)
Fit your flux to your business needs
With Numeric’s report builder, tee up reports that exactly mirror your business metrics, like grouping OpEx or all revenue accounts.
Then, run flux analysis on any one of those reports to see changes across periods and isolate where explanations are necessary with materiality thresholds.
Spot missing accruals instantly with MoM comparisons of key accounts by vendor. Track software spend by department with ease. Numeric’s intuitive reporting makes it simple for everyone, including FP&A, to find answers fast.
.webp)
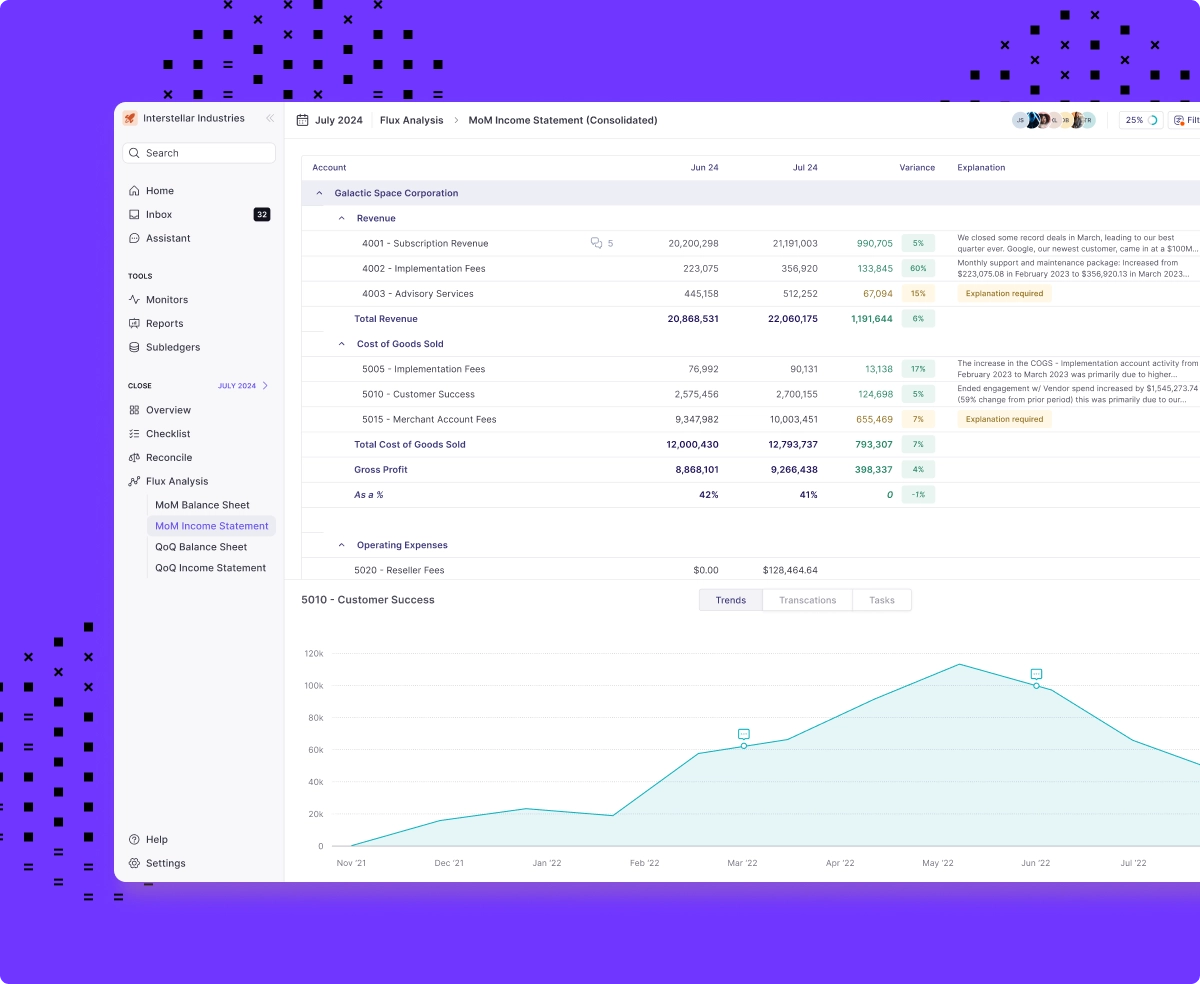
Be a trendsetter. Literally.
Easily view account trendlines and prior-period explanations to quickly understand shifts in your financials and inform explanations.
No extra clicks, exports, or pivots. Numeric’s variance analysis software pulls in every transaction from your GL so you can pinpoint exact drivers of variance without needing a second screen.
.webp)
Frequently Asked Questions
Numeric's AI-driven platform streamlines the accounting lifecycle by automating repetitive, manual tasks across critical processes like balance sheet reconciliations, flux analysis, and audit preparation. By integrating directly with ERP systems like Xero, Quickbooks, Sage Intacct, and NetSuite, Numeric pulls in real-time data and provides advanced transaction-level insights. This automation and real-time accessibility enable teams to focus more on strategic activities, such as robust variance analysis and financial planning, while ensuring that operational tasks are completed efficiently and accurately.
Numeric highlights variances by applying materiality thresholds for accounts, comparing actuals across periods, and grouping results by department or entity—helping teams focus on meaningful changes. Numeric’s AI flux writer goes further by analyzing historical trends and transaction-level data to draft detailed variance explanations based on templates provided by teams. This process eliminates manual work, surfaces actionable insights, and empowers faster, more informed decision-making.
Numeric streamlines variance analysis with features designed to eliminate manual effort and surface key insights. By integrating directly with ERP systems, Numeric automatically pulls trial balances and transaction-level data in real-time. As the most flexible flux tool on the market, teams can customize reports to group accounts by account code, department, specific vendors, locations, etc. and then set materiality thresholds to focus on significant changes.
The AI Flux Writer generates first-pass variance explanations by analyzing historical trends and transaction data, saving time and ensuring consistency. Built-in analytics tools highlight trends and fluctuations, giving teams a clear understanding of the drivers behind variances—all without the need for scripts, add-ons, or Excel.
Using Numeric translates to better insights from flux with less time spent for accounting teams. Numeric eliminates the inefficiencies of manual processes, such as combing through spreadsheets or multiple systems for data reconciliation. Numeric’s platform generates reports automatically, incorporates AI for variance explanations, and offers transaction-level detail to drill down and clarify discrepancies. This allows teams to transition from reactive data reconciliation to proactive financial insights, saving time and enhancing the quality of business decisions.
Numeric ensures data integrity by maintaining direct integrations with ERP systems, enabling real-time data syncing and eliminating the risks associated with manual data entry. The platform includes an audit trail that tracks every change, ensuring transparency and accountability. Transaction Monitors actively scan underlying ERP data for anomalies to ensure a strong data foundation for AI-drafted flux explanations to pull from. This meticulous tracking and real-time data validation make Numeric a reliable tool for accurate variance analysis.
Variance analysis software helps businesses identify core changes across periods without requiring manual data manipulation in Excel. Instead of downloading, pivoting, and drilling into data each month, with variance analysis software automatically generates reports to isolate and highlight differences between either planned and actual figures (budget vs. actuals) or actual vs. actual figures (actuals vs. actuals). This powerful tool plays a key role in financial management by highlighting variance areas where spending or income deviates from expectations. Finally, strong variance analysis software automates the tedious task of consolidating data from various sources, including dashboards and spreadsheets, making it easier to see the big picture. Understanding these discrepancies is crucial for maintaining financial accuracy and ensuring that companies stay on track with their financial goals.
Variance analysis involves comparing either budget to actuals or actuals to actuals to measure performance and understand key changes period over period. This process helps finance teams understand where they are over-spending, under-performing, and where insights from financial data can inform core business decisions. By identifying these deviations, companies can make better decisions to improve their financial health. In the arena of financial management, variance analysis serves as a critical tool to ensure resources are used efficiently and goals are met.
In the past, consolidating financial data meant manually gathering information from multiple sources. This time-consuming task often led to errors. Variance analysis software automates this process by pulling data from various financial systems. It then consolidates this information into a single platform for easy viewing. This automation not only saves time but also reduces the risk of human error, providing a more accurate view of financial statements.
Variance analysis tools offer more than just data comparison. They enhance operational control by providing insights that drive better decision-making. With features like dynamic reporting and data visualization, these tools allow CFOs and managers to track financial performance in real-time. This real-time insight enables quick responses to unexpected fluctuations and helps maintain financial stability. By offering a clear view of operations, variance analysis software empowers businesses to stay agile and responsive in a dynamic market environment.
Automating variance analysis transforms how businesses handle financial data. Instead of manually comparing numbers, software handles this task with precision. Key benefits include:
- Accuracy: Automation reduces human error, ensuring more reliable financial data.
- Efficiency: Quickly processes large volumes of data, providing insights faster than manual methods.
- Consistency: Applies the same standards and methods every time, maintaining uniformity across reports.
Manual data entry often leads to discrepancies that can skew financial results. Variance analysis software minimizes these errors by ensuring data consistency and providing real-time updates as ERP data changes. When discrepancies arise, the software identifies them swiftly, allowing for immediate corrective action. This precision in data handling leads to better decision-making, as managers rely on accurate insights to guide their strategies.
Transparency in financial reporting builds trust with stakeholders. Variance analysis software enhances this transparency by providing clear, concise variance reports that are easy to understand. These reports improve accountability and strategic decisions, as they highlight exactly where financial performance may deviate from expectations. Stakeholders can see key drivers of change and where adjustments are necessary, fostering a culture of openness and responsibility.